Projecting Happiness: Trends and Determinants
This project investigates the multifaceted factors influencing national happiness levels in 2023, utilizing the 'Life Ladder' score as a key indicator of well-being.
By integrating data from the World Happiness Report (GDP, social support, freedom, affect), the IHME Global Burden of Disease (mental health: depression and anxiety), and GWI (social media usage), this analysis provides a comprehensive view of societal happiness across 29 countries

Analytical Approach
-
Sources from three different datasets were merged including: the World Happiness Report, the IHME Global Burden of Disease, and GWI.
Missing values were addressed through careful imputation, ensuring a robust dataset for analysis.
Purpose: To create a comprehensive dataset encompassing economic, social, mental health, and digital factors.
-
Descriptive statistics were calculated to understand the distribution of key variables like Life Ladder, GDP, and depression rates.
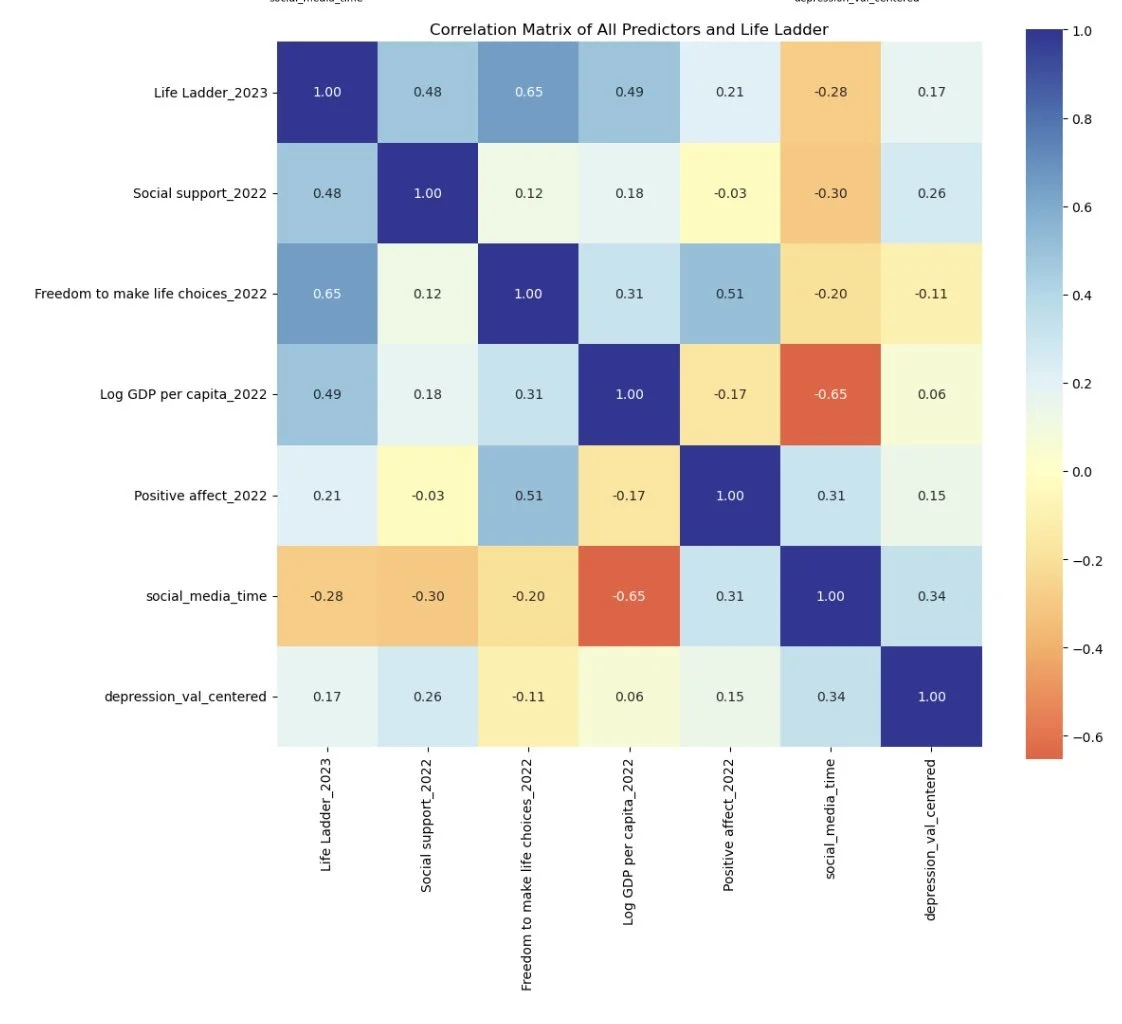
A correlation matrix was generated to visualize relationships between variables, highlighting strong associations.
Purpose: To gain initial insights and identify potential relationships.
-
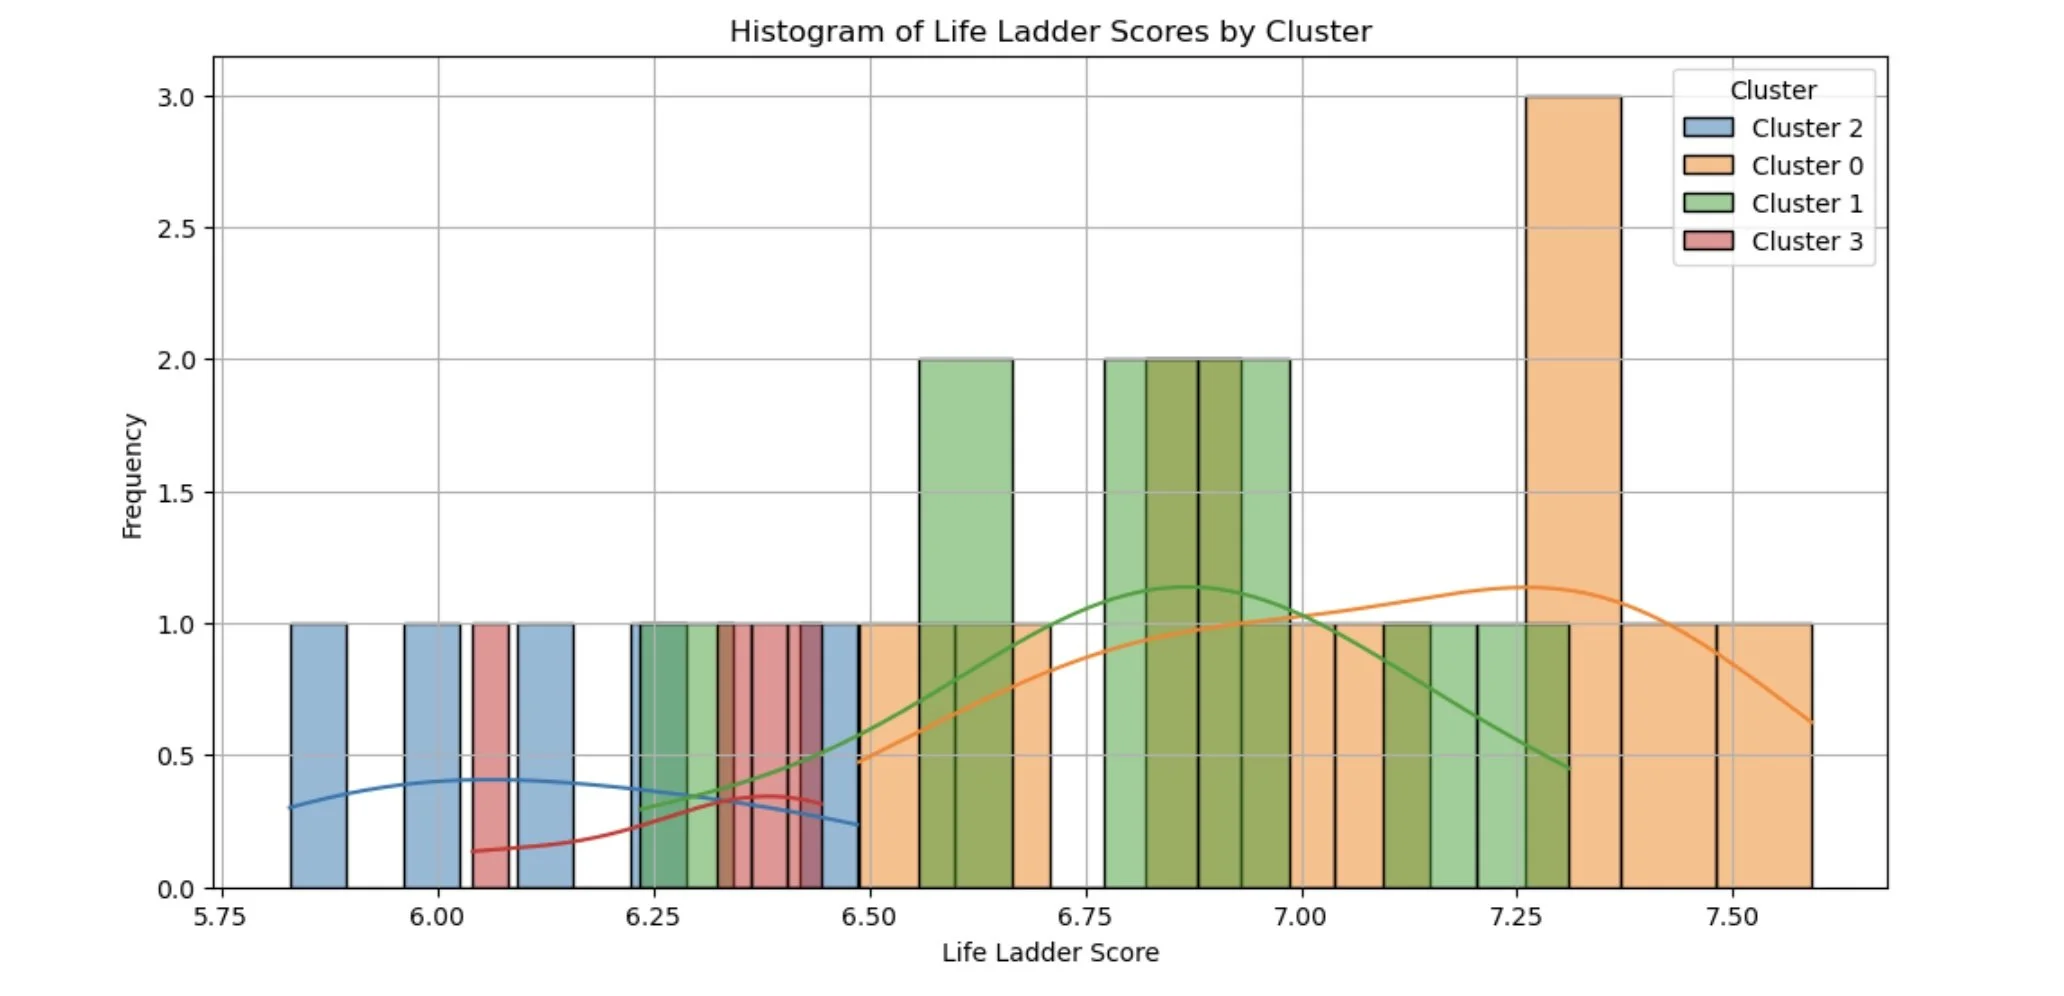
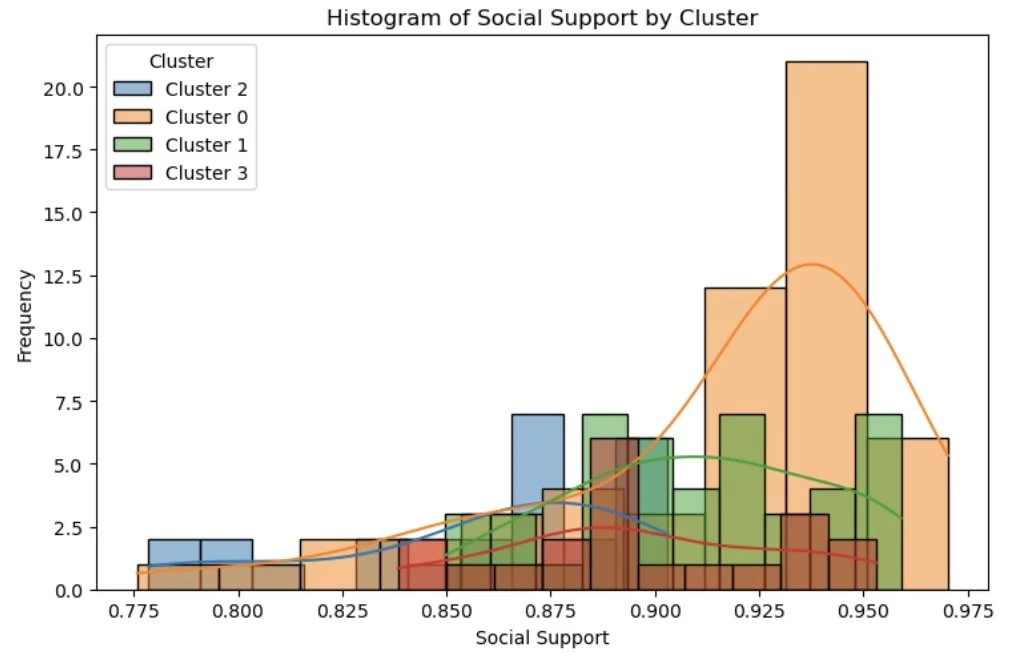
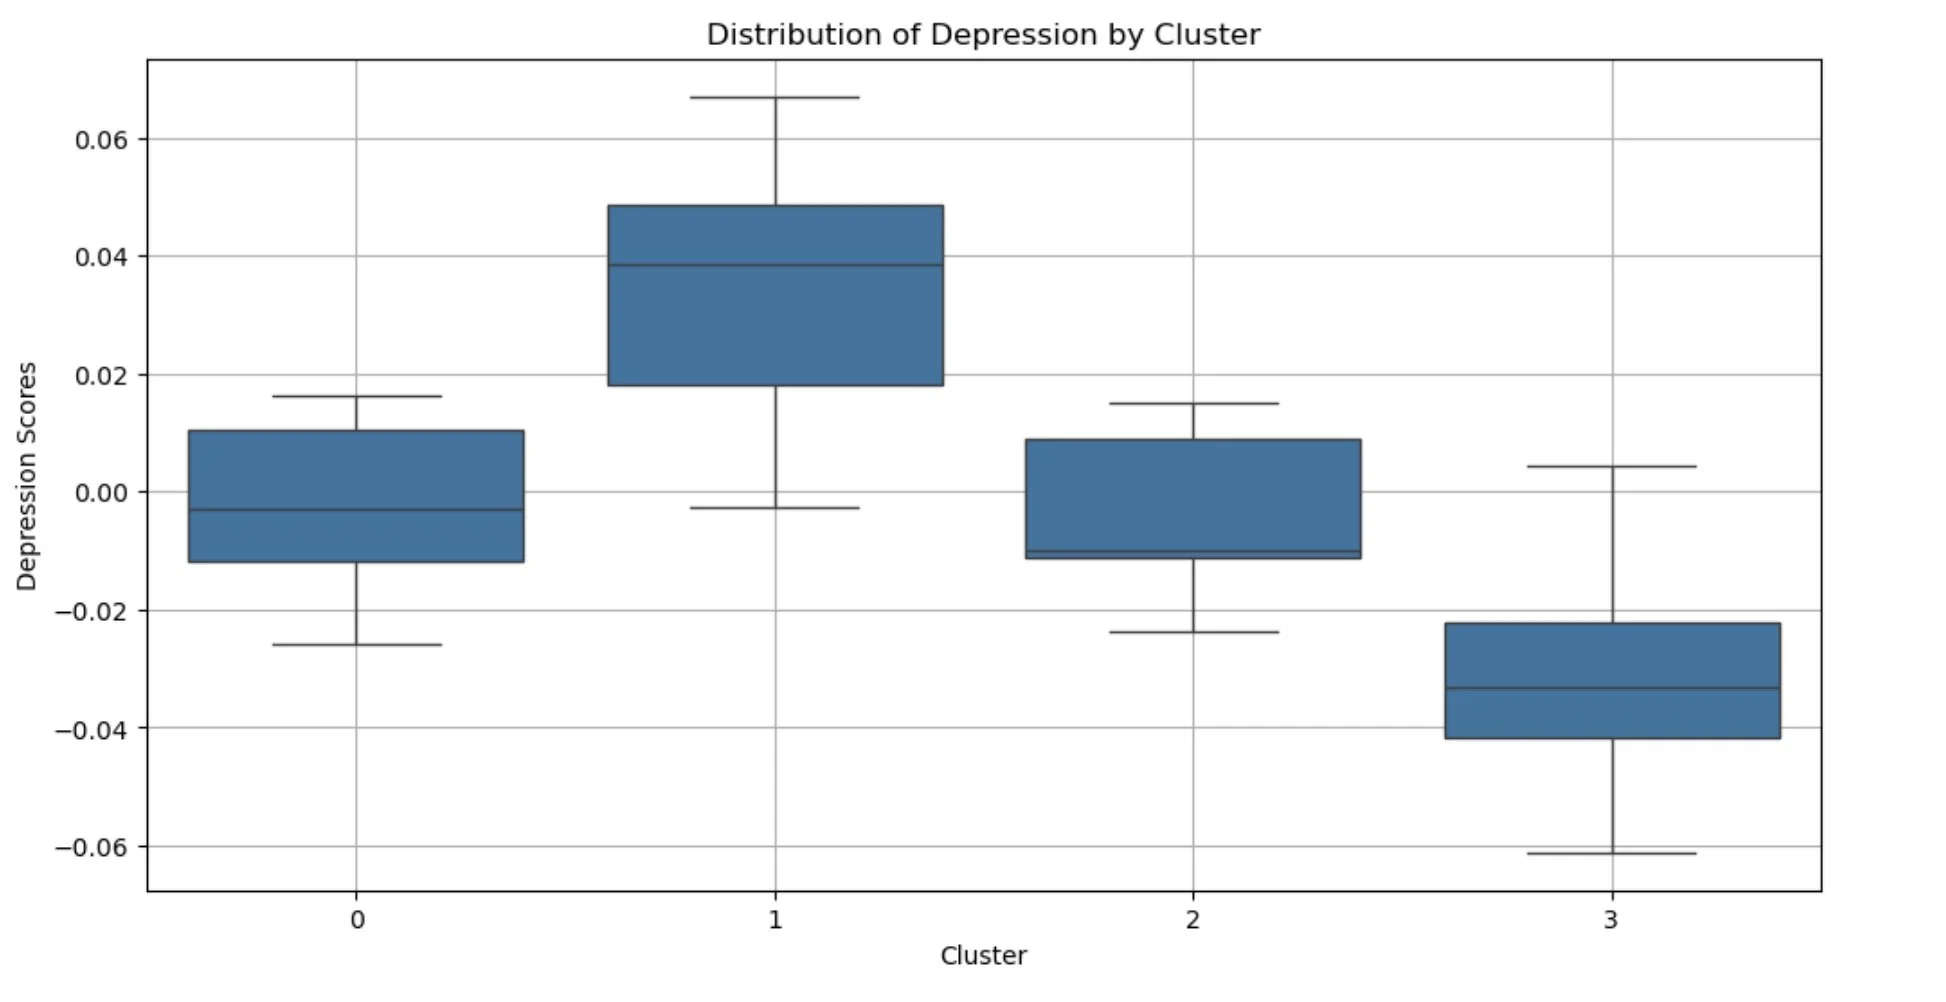
Cluster analysis was performed to identify distinct country groupings based on happiness and related metrics.
Purpose: To reveal patterns and variations in national well-being across regions.
-
Linear regression models were used to examine the relationship between Life Ladder and various predictor variables.
Purpose: To quantify the impact of each predictor on national happiness levels.
Key findings from the regression analysis were highlighted, such as significant predictors and their effect sizes.
-
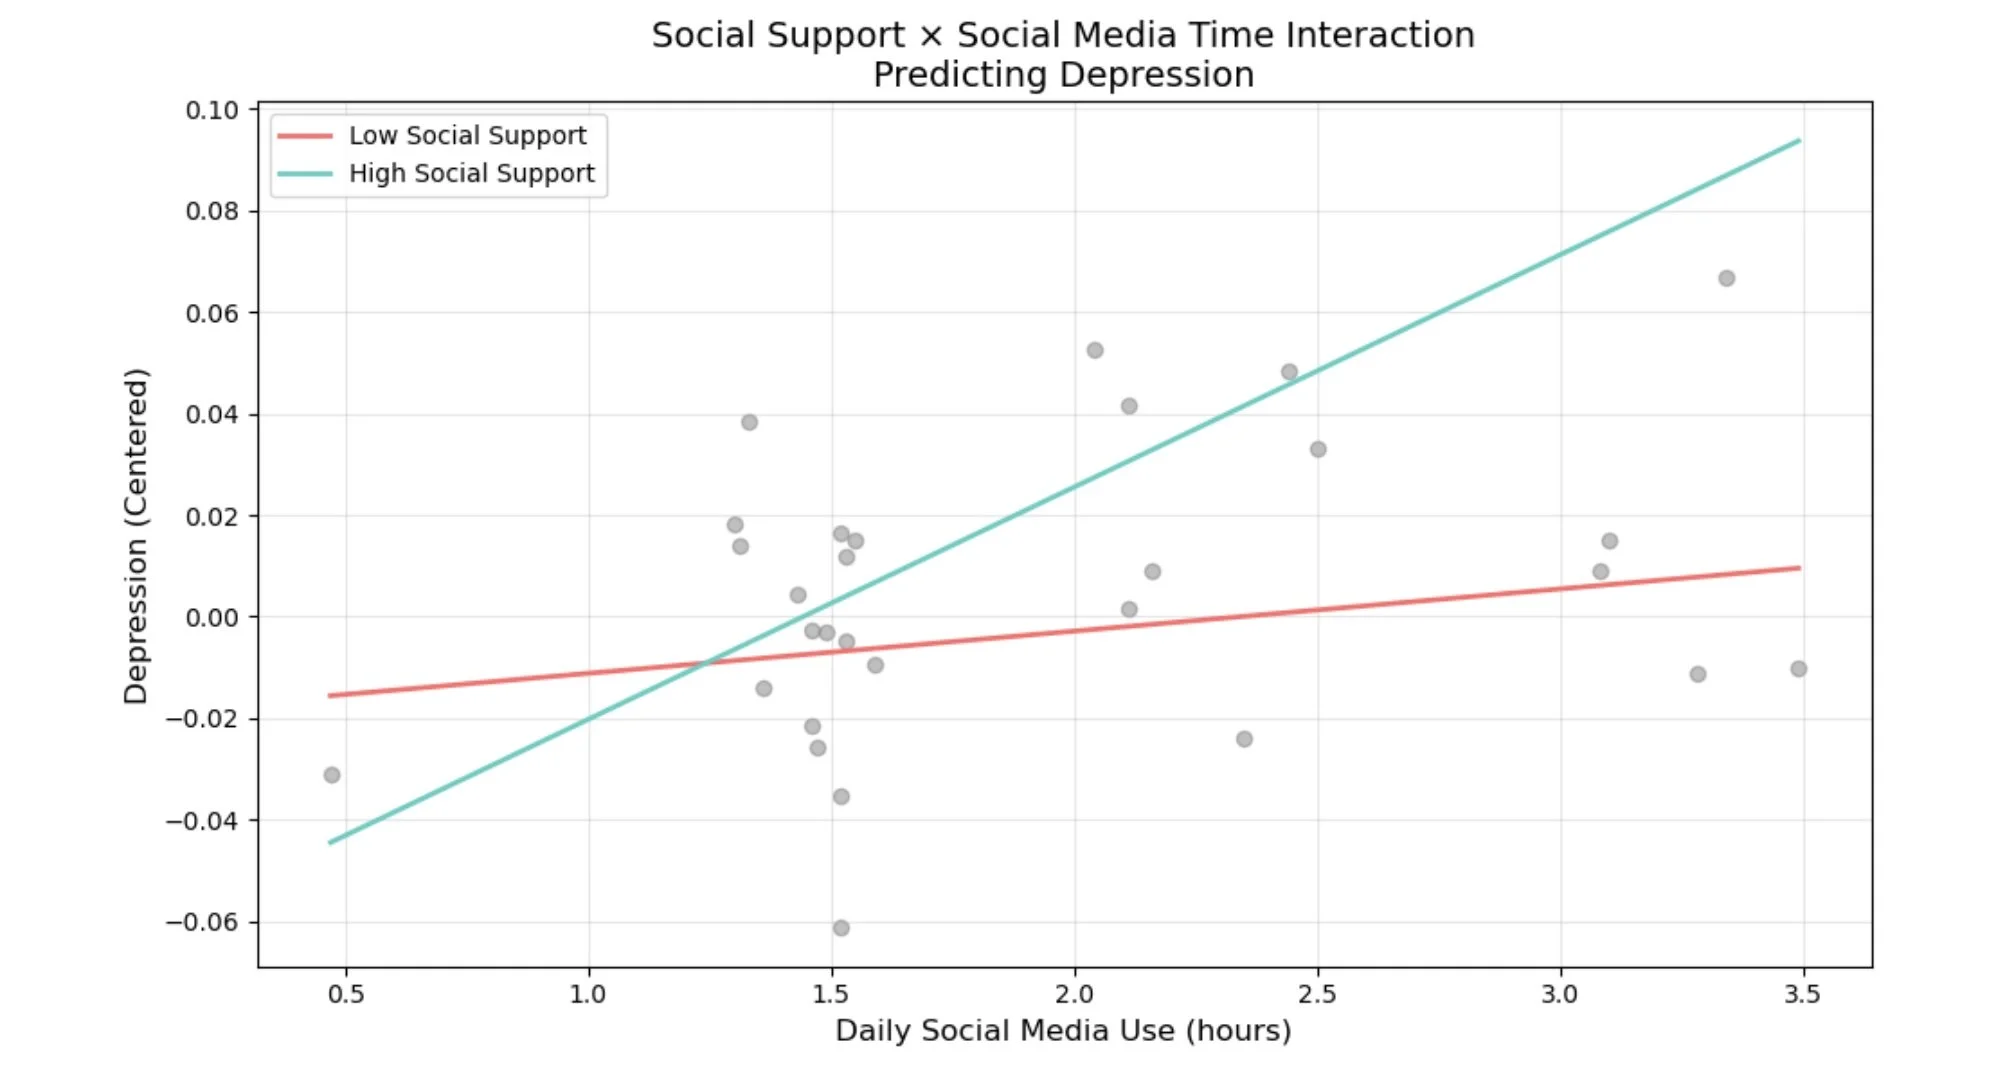
Explored how social support moderates the relationship between social media usage and depression levels.
Purpose: To understand if social support buffers the potential negative mental health effects of social media.
-
Item dA logistic regression model was developed to predict whether a country's Life Ladder score would increase or decrease.
Purpose: To assess the predictive power of various factors and identify key determinants of happiness trends.
The model's performance was evaluated using the LLR p-value and Pseudo R-squared.escription
-
Visualizations, including histograms, interaction plots, and the correlation matrix, were created to illustrate findings.
Purpose: To effectively communicate complex information and enhance understanding.
Walkthrough of Analyses
Key Findings & Future Directions:
Key Findings:
Social support and freedom to make life choices emerged as significant positive predictors of national happiness.
A notable interaction between social media use and social support was observed in relation to depression levels, suggesting a potential buffering effect of social support.
Cluster analysis revealed distinct country groupings, highlighting variations in happiness trends and resilience.
Logistic regression achieved 82.8% accuracy in predicting changes in Life Ladder scores, with freedom to make life choices as a key predictor.
Unexpectedly, higher levels of positive affect in 2022, were associated with a decreased likelihood of an increase in happiness in 2023. This will require further study.
Analysis Highlights:
The project utilized a logistic regression model (LLR p-value = 0.01639, Pseudo R-squared = 0.4302) to predict happiness trends.
Data imputation was carefully performed to address missing values across datasets.
Visualizations, including a Life Ladder histogram, social support/media interaction plots, a correlation matrix, and key predictor graphs, are included to enhance understanding.
Future Directions:
Given the trend of declining happiness among young people, future research should prioritize robust measures of social interaction, social media usage, and mental health.
This research aims to provide insights into the complex interplay of economic, social, mental health, and digital factors that contribute to national happiness."